*** Introduction ***
You will be able to see ProofPass®.com verification at Print ’05 in the AbsoluteProof booth (#8351). You will also want to look for our products in the booths of our dealers and distributors. http://colormetrix.com/dealers.php
*** Golden Nugget #11 Press Run Analysis ***
Strange as this may sound, we sometimes actually pay money for print jobs just like our customers do. Many of you have probably seen our tri-fold GcX brochure. This job has been run twice on a digital press here in the Milwaukee area. We ran into some problems getting the same color on the second run as we had on the first run. Our typically picky designer wanted the second run to look exactly the same as the first, and we got close enough, but it made me want to do some detailed analysis of the differences.
Since we have a pretty good tool for such analysis (ColorMetrix), I decided to measure the two sheets and see what the numbers and graphs would tell me. My first comment is that when evaluating a system that still puts dots on the sheet with a CMYK colorant set, density and dot gain (TVI) remain valuable tools for print analysis.
Here’s some numbers to consider
BLACK-SID
1st Run 1.63
2nd Run 1.53
DE 1vs2 2.42 CMCCYAN-SID
1st Run 1.41
2nd Run 1.51
DE 1vs2 0.87 CMCMAGENTA-SID
1st Run 1.50
2nd Run 1.52
DE 1vs2 0.82 CMCYELLOW-SID
1st Run 0.95
2nd Run 0.99
DE 1vs2 0.65 CMC
Visual evaluation of the sheets have run 1 looking darker overall (higher black density I suspect), and run 2 looking cooler or more blue. I do not think the “more blue” can be attributed simply to the higher Cyan density, since that only made a slight change in Cyan Delta E.
You will want to look at the following two PDF’s before reading further.
http://www.colormetrix.com/jim/gn11-greybalance.pdf
http://www.colormetrix.com/jim/gn11-dotarea.pdf
As you look at the PDF L*a*b* plot, the circles represent Run 2, and the triangles represent Run 1. On the Dot Area plot it is the opposite. Sorry for the confusion…
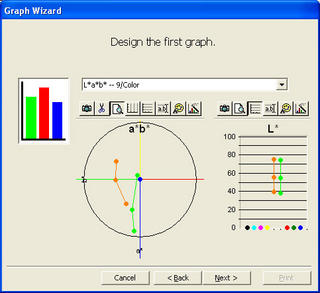
You will see that our second run has lower Magenta Dot Gain (TVI) to go along with the lower Cyan density. It seems to me that these two factors combined to cause a shift in grey balance which is clearly seen on the following image:
The grey balance plot is showing the absolute positioning of Run 1 (Green circles and lines) and Run 2 (Orange circles and lines). The three plots for each run represent a balanced 3/color grey at 25%, 50% and 75%. While the Delta E of each of Solid inks is well within visually acceptable guidelines, the Delta E shifts of the 3 greys patches are not.
DE-CMC(2:1) RUN 1 VS RUN 2
GREY-75%
5.7GREY-50%
7.23
GREY-25%
4.45
My overall conclusion is that once again for the umpteenth time in the last several weeks grey balance has proven the overall winner in visual appearance consistency. For those of you who utilize our ColorMetrix software harvesting the print data for the above charts graphs and numbers is a snap.
I will be bringing the two press sheets to Print ’05, so if you visit me there you can take a look in a light booth and compare for yourself. I would love to add the opinions of a few color experts to this analysis.
Because of Print ’05 there will be no planned Golden Nugget next week, but I will try and post daily at JimRaffel.com along with pictures of exciting new technology I find at the show.
As always you can contact me at: raffelj@colormetrix.com
